Announcements
Loading…
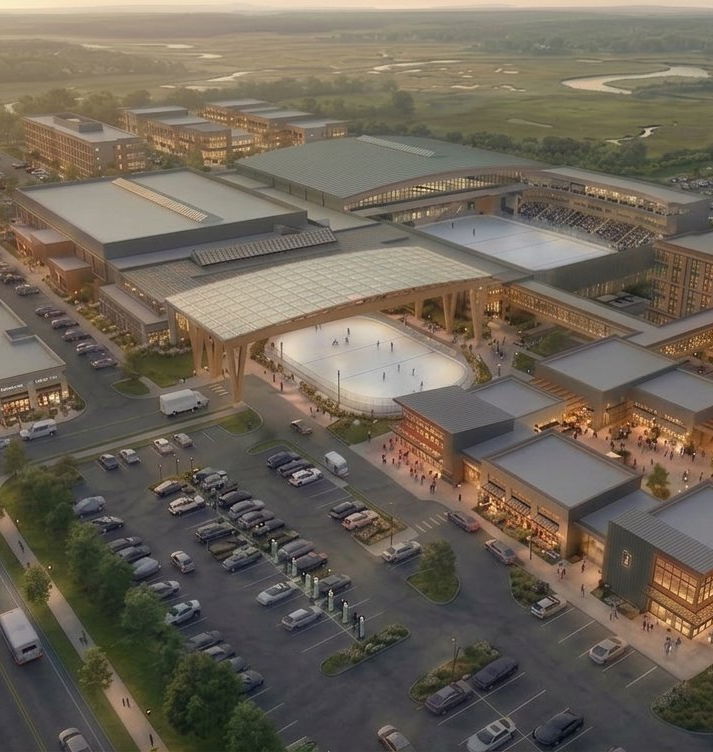
The District at Salisbury
$344M mixed-use sports, hospitality & entertainment campus · 99.5 acres · Salisbury, MA
Deal Timeline
Loading…
Key Contacts
Loading…
The Thesis
Hockey Supply Gap
40,000+ registered youth hockey players within a 50-mile draw · 26 facilities + 38 sheets within 35 miles, ZERO hotel-integrated · 5 sheets + 3,200-seat NAHL arena opens 2,526+ pre-committed anchor hours Day 1.
Dual-Season Demand
Winter hockey tournament families (Oct–Apr mandatory blocks) + summer Salisbury Beach leisure (100,000+ daily peak visitors). 400-key dual-flag Marriott captures both.
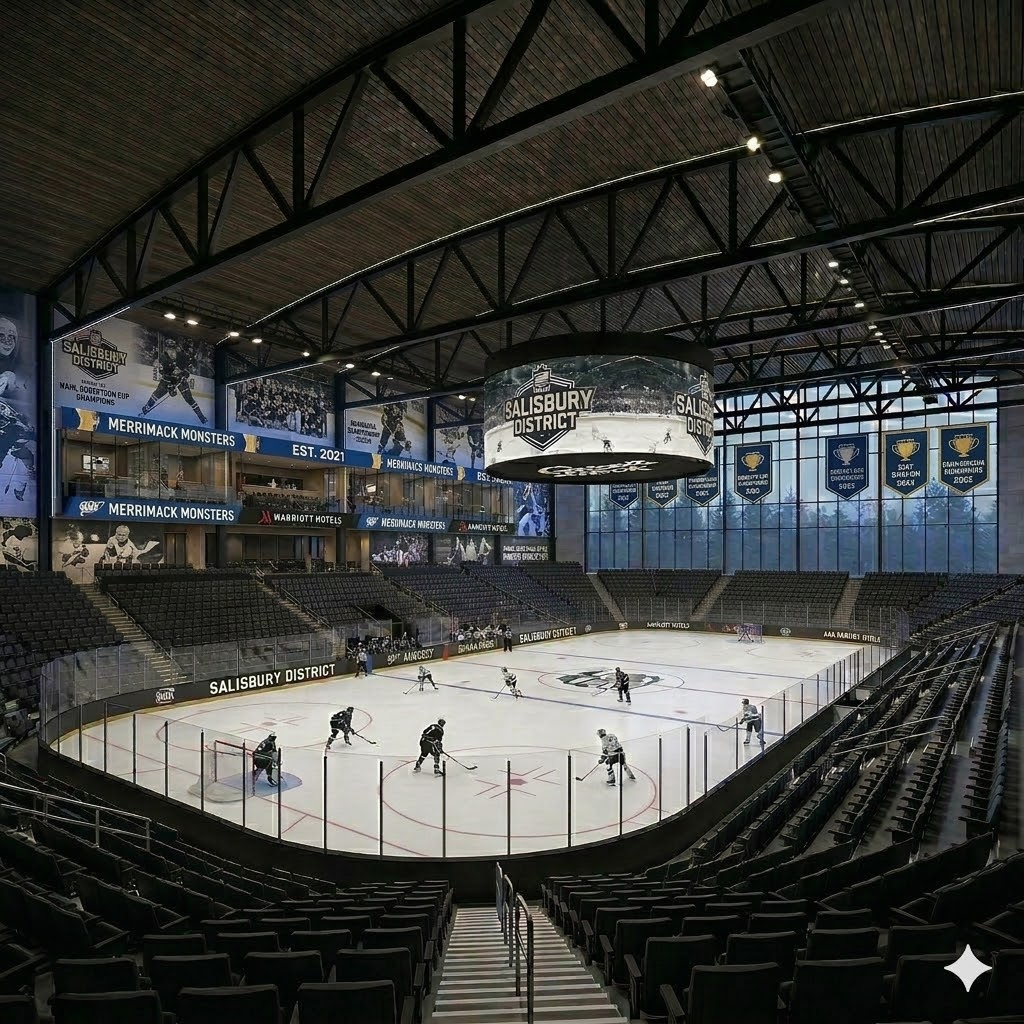
NAHL Anchor Tenant
Merrimack Monsters — Tier II junior hockey expansion franchise. Zero NAHL team within 90 miles. 28+ home games/yr drive hotel blocks, F&B, regional identity. Neon green and black brand · "Rise from the River" · EST. 2029.
Entertainment Program
3,200 fixed seats · 4,000–4,200 GA floor. 38 events/yr April–September. $5.16M Yr3 event NOI. Artist tier: Noah Kahan, Nate Bargatze, TBT Basketball.
Capital Structure
| Tranche | Amount | % TDC | Terms |
|---|---|---|---|
| Senior Construction Loan | $75M | 21.8% | 6.5% IO · Needham Bank syndicate |
| EB-5 Ice Facility | $28M | 8.1% | 4.5% IO · $500K × 56 visas |
| TIF / Public Incentives | $22M | 6.4% | Salisbury TIF + MassWorks + IRA |
| LP Contingency Reserve | $26M | 7.6% | Escrowed · cost overrun + Yr1 pref |
| LP Equity (Invested) | $193M | 56.1% | 7% pref · 25/35% tiered promote |
| TOTAL DEV COST | $344M | 100% | LP Gross $219M · Pre-Dev $2.5M convertible |
Document Library
Your access tier determines which documents you can view and download. Activity is logged. Documents update in real-time.
Loading documents…
LP Returns Calculator
Interactive model across cap rate and hold period scenarios. All figures based on v10.11 canonical base case.
Scenario Inputs
Lower cap = higher exit value. Base 5.5%. Bull 5.0%. Bear 6.0%.
Base 15 years. Yr7 early exit option. Yr5 cash-out refi option.
v10.11 canonical 3.79% growth produces Yr15 NOI $37.1M.
v10.11 base $23.74M. Conservative $20.74M. Optimistic $26M.
Projected Returns
Assumptions (locked)
- LP Invested: $193M · 7% cumulative pref (non-compounding)
- 25% GP promote Tier 1 (to 1.8× MOIC) · 35% Tier 2
- Senior debt ~$125M at stabilized exit · 1.5% exit tx costs
Note: This calculator applies a constant 3.79% NOI growth rate. Canonical figures use a non-constant stabilization-and-growth schedule, so calc results may show ~1-2% drift from the canonical headline values ($548M net / 3.35× / $103.7M Yr15 base) when at preset defaults. The canonical values are the authoritative numbers; the calculator is a sensitivity tool.
Canonical Scenarios
Questions & Answers
Submit questions about the deal. Admin answers are optionally marked public (visible to all investors) or private (visible only to you).
★ Frequently Asked
All Questions
Loading…
Admin Panel
Manage users, documents, announcements, timeline, and contacts.
Users
Invite new investors below, or click any existing row to change tier / pick custom docs / add notes.
Invite a new investor
Creates a Firebase Auth user with a generated temp password. You'll see the password once — copy it and share with the investor (via text/email/verbal).
All Users
Loading…
Documents
Upload new document
Existing documents
Loading…
Announcements
Post new announcement
Existing announcements
Loading…
Deal Timeline
Click "Change status" to cycle: pending → active → complete → pending.
Loading…
Key Contacts
Loading…
Quick Links — Interactive Views
Direct links to interactive HTML views (un-watermarked). Admin-only convenience access · do NOT share these URLs externally · the watermarked PDF in the main Documents view is what gets shared with non-admins.
Activity Log
All document views and downloads, all investors, chronological.
Loading…